
In my first post of this series, I introduced how the combination of behavioral finance and automatic plan features is reshaping retirement outcomes.
In this post, I will present you with compelling research and evidence on the behavioral and psychological barriers to saving and projected retirement income replacement rates.
So let’s start by examining a fascinating social science research study. I actually came across this experiment in Daniel Pink’s book To Sell Is Human: The Surprising Truth About Moving Others, a fantastic read if you have any responsibility for leading, motivating, or moving people.
In 2011, a group of researchers led by social psychologist Hal Hershfield conducted a fascinating series of experiments to determine barriers that keep people from saving.
The concept of saving for retirement seems pretty simple, and you would expect most rational people to both realize they need to save and be able to do it. It’s really just a trade-off between immediate rewards versus future rewards. Unfortunately, our brains are actually wired in a way that makes people incredibly bad at choosing rewards we have to wait for, and we often choose immediate rewards even when we know it’s not in our best interest. Think about the adage, “a bird in the hand is worth two in the bush.”
As part of the experiment, the researchers used computer animation to show people a digital avatar of themselves (i.e., their “current self”) and what they would conceivably look like at age 70 (i.e., their “future self”). They had half the participants use a virtual reality headset. They saw their current self avatar for about a minute and then had a minute-long conversation with a researcher’s digital representation. The second group followed the same process, except they saw their “future self” instead of their current self. You can see an example of the morphing procedure using Hershfield’s own picture below.

Afterward, the experimenters told all the participants to imagine they had unexpectedly received $1,000, and they had to choose to allocate the money among 4 different options, which included buying something nice for someone special, investing it in a retirement fund, planning fun, and extravagant occasion and putting it in a checking account. The group who saw their current selves saved an average of $80 in the retirement account. However, the group that saw their future self allocated $172 to the retirement account or more than twice the current self group.
Now the researchers wanted to see what was driving that difference – whether it was the sight of their own aging face or just a reminder of aging in general. Using a different group of participants, they followed a very similar process, except half the participants saw an age-morphed picture of themselves. In contrast, the other half saw an age-morphed picture of someone else.
The results were clear – those who saw the 70-year-old picture of themselves saved significantly more than those who saw a picture of a 70-year-old. These studies showed that the issue isn’t just our inability to weigh immediate versus future rewards. It’s the fact that we often feel a disconnection from our future selves. That’s because it’s so difficult to envision our lives that far into the future that we often think of our future self as an entirely different person.
In the research paper, Hershfield and his colleagues stated that “to people estranged from their future selves, saving is like a choice between spending money today and giving it to a stranger years from now.” However, showing people an image of themselves getting old helped foster that psychological connection, which caused people to save more.
The results of this study have all sorts of interesting implications. Still, I think it highlights the inability and ineffectiveness of simply trying to educate participants to save more. As an industry, incredible amounts of time and money have been spent trying to educate people and better balance short-term and long-term rewards with the little incremental impact being made.
Think about the shiny brochures and educational materials with pictures of smiling older faces looking completely healthy and happy in retirement. Given the results from this study, is it any wonder this information doesn’t sink in and change the behavior of the vast majority of participants? As we’ll see, the traditional approach to plan design is very ineffective at overcoming the behavioral inertia that keeps people from saving for retirement. Alternatively, automatic plan design uses that inertia for participants as opposed to against them.
Now let’s change gears and spend a few minutes talking about income replacement rates. The retirement income challenge is really just a math equation. If we can identify the projected amount of money needed with some level of confidence, we can then work backward and use the current amount of money a participant has and our sources of income and assumptions about projected rates of return to solve for the level of annual savings required.
In 2012, a researcher with Dimensional Fund Advisors, Dr. Marlena Lee, attempted to project the replacement rates needed by retirees as a percentage of gross pre-retirement income and the breakdown between Social Security and personal savings as pension income and 401(k) assets. In her research, she simulated income and portfolio paths of 10,000 households, and the working years are age 25 to 65, with full retirement occurring at age 66.
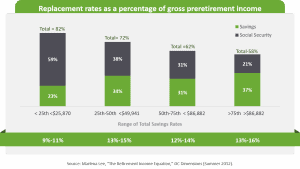
According to her results, lower-income workers were projected to need a higher overall replacement rate but a lower amount needed to come from personal retirement savings due to Social Security contributing a higher percentage of replacement income. For instance, workers with income in the bottom quartile (represented by the bar to the far left) were projected to replace 82% of their pre-retirement income. Social Security was projected to contribute 59%, and 23% needed to come from personal retirement savings. To replace that 23% of income, these workers needed total savings rates of between 9% and 11%. Total savings rates included both employee deferrals and employer contributions.
At the other end of the spectrum, those in the highest income quartile and making more than $86k per year had a lower overall projected replacement rate of 58%. Still, Social Security made a much smaller contribution of only 21%. This meant the worker would need to replace nearly 40% of their pre-retirement income through personal retirement savings and needed total savings rates between 13% and 16%.
So essentially, Dr. Lee’s projected that the typical worker would need to replace somewhere between 20% and 40% of pre-retirement income from their own savings. Obviously, if someone is lucky enough to have an employer pension, that will take some pressure off the level of personal savings. Unfortunately, in this day and age, pension income is few and far between, which means most current and future generations of workers will need to replace all of this income through personal savings alone.
It’s also important to realize that in Dr. Lee’s research, workers began saving at age 25 to derive the outcomes we just looked at, and this is why starting early is so important. Please think of this as the importance of early diagnosis in our cancer example from Part 1of this series.
Here, I’ve highlighted additional data points from Dr. Lee’s study. On the left chart, you can see the projected annual savings rates for replacing 40% or 20% of income based on success probably. For instance, a higher-paid employee who needed to replace 40% of their income and wanted a 95% confidence level would need to average total savings rates of 16.8%. At a 5.2% total savings rate, it was basically a coin toss. Similarly, a lower-paid employee that needed to replace 20% of their income and wanted a 95% confidence level would need to average total savings rates of 8.2%.
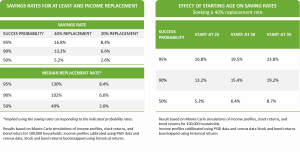
The right chart illustrates the detrimental impact of waiting to begin saving. Postponing retirement savings for 5 additional years to begin saving at age 30 required annual savings increases of nearly 3% from age 25, and waiting an additional 10 years increased the annual savings rate by 7%. Think of this like having a later stage cancer diagnosis – the longer you wait, the worse the prognosis, the lower the probability of survival, and the more aggressive the required treatment.
In Part 3 of this series, I’ll share industry data on adopting automatic plan features and highlight how these trends are shaping retirement outcomes.
If you want to find out how Greenspring Advisors can help your employees overcome their behavioral and psychological barriers to saving, let’s talk.