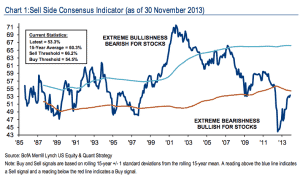
There is really no indicator that we know of that can predict stock market performance. If there ever were, it would very quickly be arbitraged away since markets tend to be fairly efficient. Merrill Lynch uses a metric they call the “Sell Side Indicator” to determine future stock performance. The indicator attempts to measure Wall Street analyst’s optimism or pessimism towards stocks. The theory goes that the more pessimistic analysts are about stocks, the better the time to invest. Here is the chart:

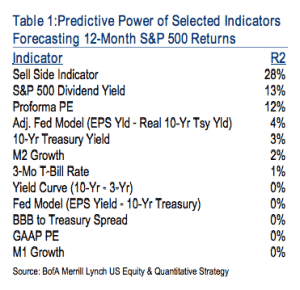
You can see that while the indicator has come back recently, it is still at the lows of 2008 and is considered to be extremely bullish for stocks. Of more interest to me is their backtesting on this metric. As you’ll see, it has better predictive power than many other common metrics:

With that being said, it still only has an R squared of .28. To give you an idea of what that means, if it had perfect predictive power, it would have an R squared of 1, so it is far from accurate. One of the best takeaways from this report is that there is no metric you can use to predict stock market performance with any degree of certainty.


